Warren, Peggy
product information
Condition: New,
UPC: 9781423247272,
Publication Date: Mon, November 1, 2021,
Type: Calendar/Blank Book ,
description
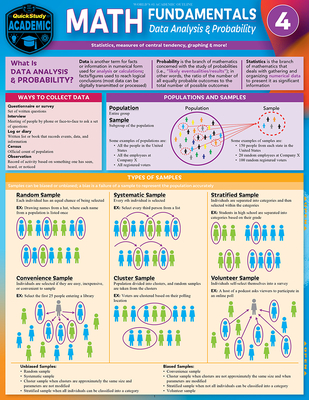
cs to support early learning, continued development, and as a reference to review during and after building a strong foundation. Seeing a broad overview and how the details make the math possible in just 6 pages can melt away some math phobia and will strengthen skills and grades. Written and tested in a classroom over many years, two teachers came to us with this reference they used with their students. A math textbook authoring group then expanded the series. With experts in the classroom and in textbooks developing the content, don't pass up this 6 page laminated, inexpensive tool with the power to support the core areas of math students struggle with. Check other titles in the 5-guide series for the areas of support most needed.
6 page laminated guide includes:
6 page laminated guide includes:
- Ways to Collect Data
- Populations & Samples
- Types of Samples
- Random Sample
- Convenience Sample
- Systematic Sample
- Cluster Sample
- Stratified Sample
- Volunteer Sample
- Measures of Central Tendency
- Measures of Spread
- Range
- Interquartile Range (IQR)
- When to use Measures of Center & Spread
- Symmetric Distribution (also called Normal Distribution)
- Negatively Skewed Distribution (also called Left Skewed Distribution)
- Positively Skewed Distribution (also called Right Skewed Distribution)
- Interpretation of Graphs
- Ways to Prevent Misinterpretation of Graphs
- Graphing Data
- Checklist for Making Graphs
- Data Displays
- Pictograph, Frequency Table, Tally Marks
- Bar Graph, Double & Multiple Bar Graphs
- Stacked Bar Graph
- Two-Way Frequency & Relative Frequency Table
- Circle Graph (also called Pie Chart) & Steps to Make Circle Graph
- Scatter Plot & Steps to Make a Scatter Plot
- Box-and-Whisker Plot & Steps to Make a Box-and-Whisker Plot
- Histogram & Steps to Make a Histogram
- Distributions in Histograms
- Line Graph & Line Plot
- Stem-and-Leaf Plot
- Multiple Line Graph
- Double Stem-and-Leaf Plot
- Interpreting Statistics
- Interpolation / Extrapolation
- Normal Distribution
- Venn Diagram
- To determine if a set of data has any outliers:
- Matrix
- Disjoint Sets
- Interpreting the Venn Diagram
- Probability
member goods
No member items were found under this heading.
notems store


listens & views


Return Policy
All sales are final
Shipping
No special shipping considerations available.
Shipping fees determined at checkout.